|
|
The group’s current research concentrates on the following topics: (1) Hydroclimatology and seasonal precipitation prediction using observations and climate models, (2) global precipitation estimation from space-borne microwave sensors, and (3) river delta network topology and dynamics for process understanding and prediction. The mathematical methodologies we use to unravel patterns and use them for process understanding, estimation and prediction include spectral and wavelet analysis, regularized estimation, machine learning, spectral graph theory, and nonlinear dynamics.
Climate dynamics and seasonal prediction of precipitation
We aim to improve our understanding of how climate variability and change impact hydroclimate on different spatial (regional to global) and temporal (seasonal to decadal) scales. An important goal is to systematically identify sources of predictability of regional hydroclimatic variability to enhance physical understanding and improve seasonal prediction. Basic research questions include: How will climate change impact teleconnections, water cycle dynamics and climatic extremes in the tropics and midlatitudes? Which of these changes can be attributed to multi-decadal natural variability vs. climate change? Our research uses a diverse set of approaches including statistical and Bayesian analysis, machine/deep learning, network theory, and climate modeling. We utilize state of the art observations from space and land, reanalysis datasets and outputs from climate models of different complexity. Specific research results are discussed below.
Exploring sources of predictability of southwest US precipitation
Reliable prediction of winter precipitation in the southwestern US (SWUS) remains a challenge with significant implications for the economy, water security and ecosystem management of the region. Physics-based deterministic models show limited predictive ability of precipitation as the lead time increases, due to imperfect representation of physical processes and incomplete knowledge of initial conditions. Similarly, statistical methods drawing upon established climate teleconnections (e.g., ENSO) have low predictive skill due to the complex nature of the climate system.
Our recent work has highlighted the emergence of new teleconnection in the subtropical Pacific (the New Zealand Index; Mamalakis et al., 2018, 2019) which has the potential for earlier and more accurate prediction of SWUS precipitation. Yet, further improvements can be achieved by exploring the whole Pacific ocean dynamics as predictors and our recent work focuses on developing new machine learning (ML) methodologies for data-driven prediction in climate applications. Our ML methods are specifically designed to account for highly correlated features or covariates, nonstationarities, and nonlinear interaction terms in high dimensional settings.
The schematic below illustrates the proposed new regularization approach, called the Graph Total Variation (GTV), which is guided by the space-time correlation of the covariates (in this case Sea Surface Temperatures, SST or Geopotential Height, GPH) to inform a graph-based regularizer, in order to promote similar weights for highly correlated predictors, enforce sparsity and unravel the most explanatory predictive features without specifying them a-priori. To address the issue of the short observational record and robustly estimate the strength of correlations among the predictor variables, we make use of a large ensemble of climate model outputs to reduce the structural uncertainty in the predictor variables, enforce sparsity, and improve prediction accuracy.
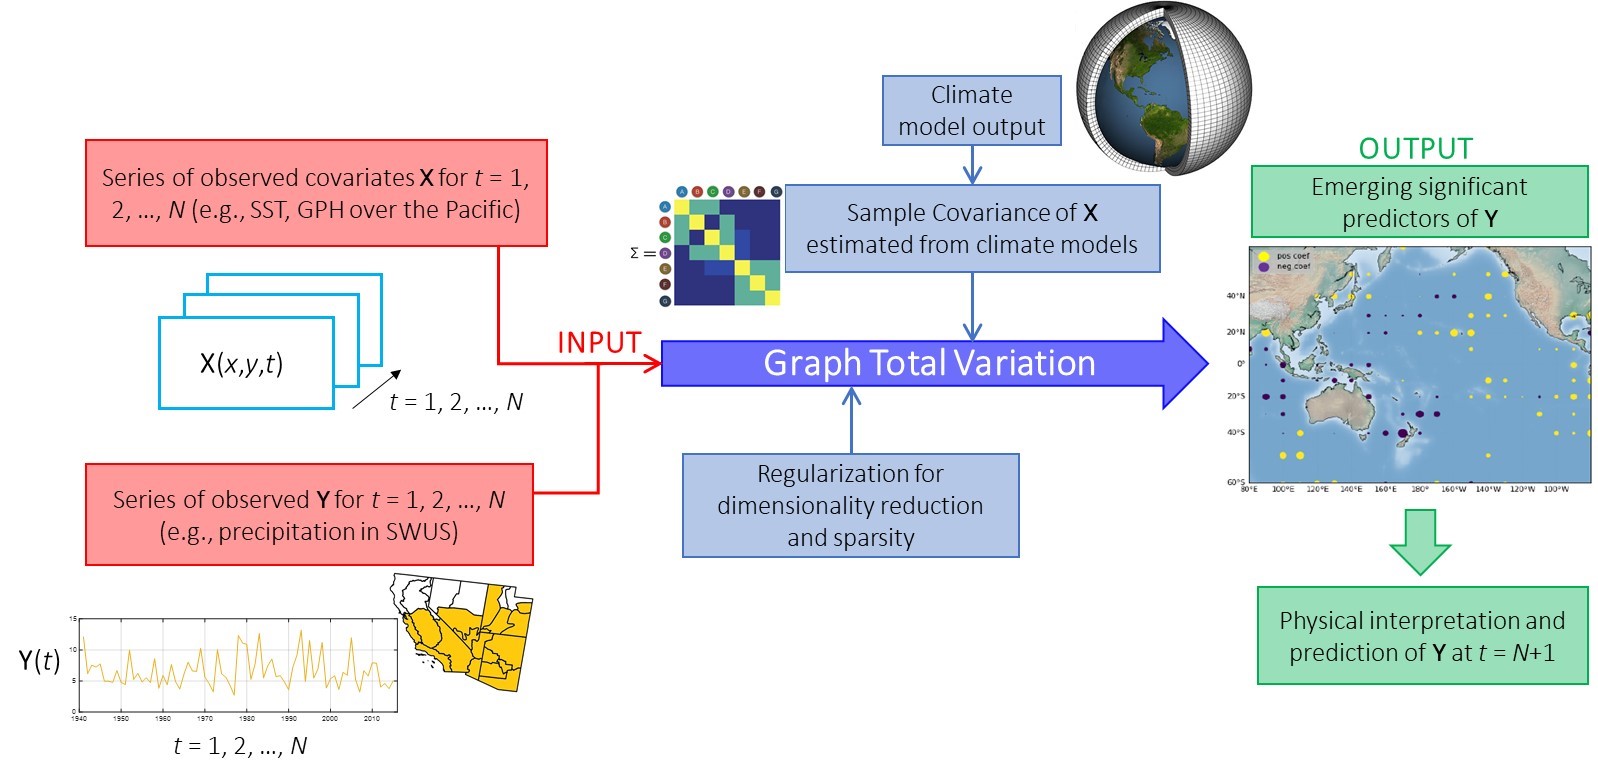 Mining observations and climate model outputs for improved understanding and regional hydro-climate prediction. Graph-guided regularization for predicting winter precipitation over SWUS. We use observed Pacific SSTs to inform our prediction, and we form a space-time covariance graph with edge weights corresponding to pairwise correlations to constrain our regularization scheme. Correlations are estimated based on the output of climate models towards improving the estimation of the dependencies of the predictors and increasing the overall performance of the algorithm. Emerging significant predictors are analyzed for physical interpretation and attribution.
Impacts of climate warming to tropical precipitation
The location of the intertropical convergence zone (ITCZ) and its seasonal migration control precipitation patterns in the tropics, and greatly affect vulnerability of ecosystems and rainforests. Thus, future changes in the location of the ITCZ under climate change are of vital importance for local water management and security in tropical and subtropical regions.
Currently, the ITCZ lies in the northern hemisphere, yet its position varies along different longitudes and seasons. On multidecadal scales, the position of the ITCZ is influenced by the atmospheric heating contrast between the two hemispheres and under climate change, some studies anticipate an average northward shift and contraction of the ITCZ; however, predictions remain uncertain and highly vary among different models. Also, most studies have focused on the zonal mean changes of the ITCZ, without providing insight into the regional ITCZ responses, and possibly masking model agreements over particular areas.
In our work we use a longitudinally explicit probabilistic method (see details in Mamalakis and Foufoula-Georgiou, 2018) to track the ITCZ and explore future ITCZ trends in all seasons and longitudes of the globe, under increased CO2 emissions (scenario RCP8.5). After accounting for double-ITCZ biases in the models, we document a seasonally-robust, zonally diverging response of the ITCZ, which is summarized as a northward shift of the ITCZ over eastern Africa and Indian Ocean, and a southward shift in south America, and the eastern Pacific and Atlantic basins. We also show that the diverging response of the ITCZ is consistent with future changes in the tropical SST and extra-tropical energy imbalances in the atmosphere.
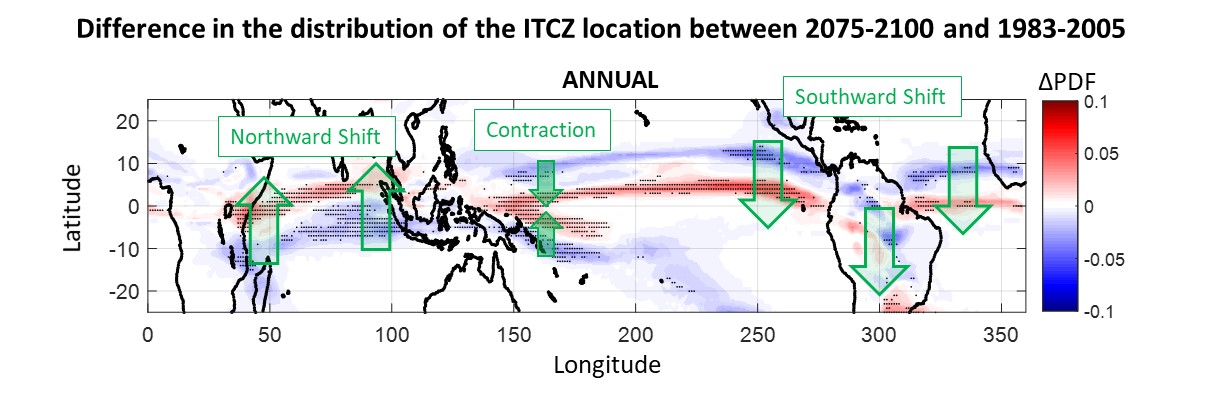 Future changes in the ITCZ location under climate change derived from the low-bias CMIP5 models. Difference in the annual probability density function (PDF) of the location of the ITCZ between 2075-2100 and 1983-2005. The multi-model mean is presented, while stippling indicates agreement in more than 3/4th of the models considered. Results indicate a robust northward ITCZ shift over eastern Africa and Indian Ocean and a southward ITCZ shift over south America, and eastern Pacific and Atlantic Oceans.
Estimating precipitation from space
Building upon the heritage of the Tropical Rainfall Measurement Mission (TRMM), the international Global Precipitation Measurement (GPM) program aims at providing knowledge and data on rain and snow all over the globe for both climate science and operational weather prediction.
The GPM constellation consists of 13 satellites orbiting the earth, each equipped with a passive microwave imager (GMI), providing frequent measurements of the microwave radiances at the top of the atmosphere. These radiances are the product of the surface emission, emission and absorption by liquid rain drops and scattering by ice particles in the atmosphere. They are converted into brightness temperature (TB) for physical interpretation. Only the GPM Core observatory boards, in addition to the GMI, a dual-frequency precipitation radar (DPR) which provides important information on cloud hydrometeor structure.
Improving GPM passive microwave precipitation retrieval using pattern information.
Our group’s work focuses on improving the algorithms performing the inversion of the multispectral signatures measured by microwave imagers into hydrometeor profiles. The current operational algorithms, such as the NASA algorithm GPROF, perform the retrieval at the “pixel” level; meaning that they retrieve the hydrometeor profile at a given location (i.e. in a pixel of about 10x10 km) using only the spectral measurements at this location, and ignoring the surrounding observations and the spatial-temporal dynamics of the measured signal. On the contrary, our proposed “nonlocal” retrieval approach utilizes the pattern information and the spatial dynamics of the observed fields of brightness temperature.
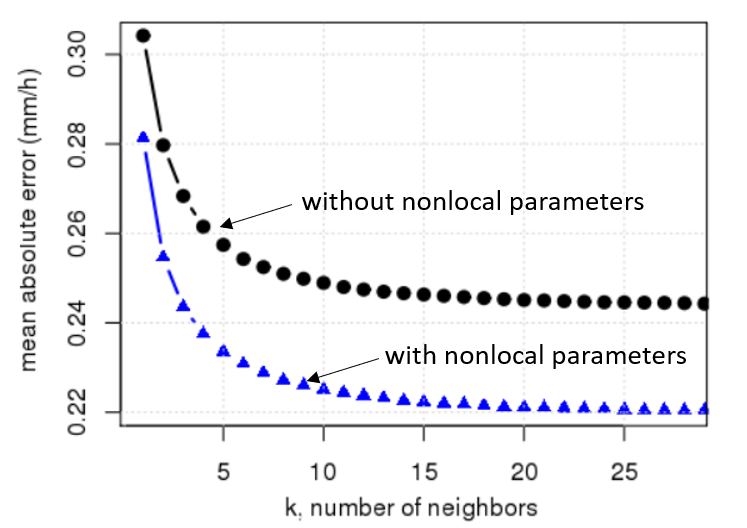
The easiest way to extract patterns and spatial dynamics from the 2D fields of brightness temperature is to use convolution filters. When added to the observation vector to create enriched spectral signatures, the nonlocal parameters extracted by the convolution filters help to better constrain the inversion problem and reduce the uncertainty in the retrieval of hydrometeor profiles and surface precipitation rates. There is potentially an infinite number of nonlocal parameters which can be computed, and the challenge is to determine a small number of parameters providing useful information on precipitation. The merits of our approach have already been demonstrated by using a specific class of physically-informed convolution filters (spatial derivatives along the imager's observation direction) which how significant improvement in the retrieval (see Figure below); Guilloteau and Foufoula-Georgiou (2020a,b). A more generalized approach is currently under development which includes the use of Convolutional Neural Networks (CNNs).
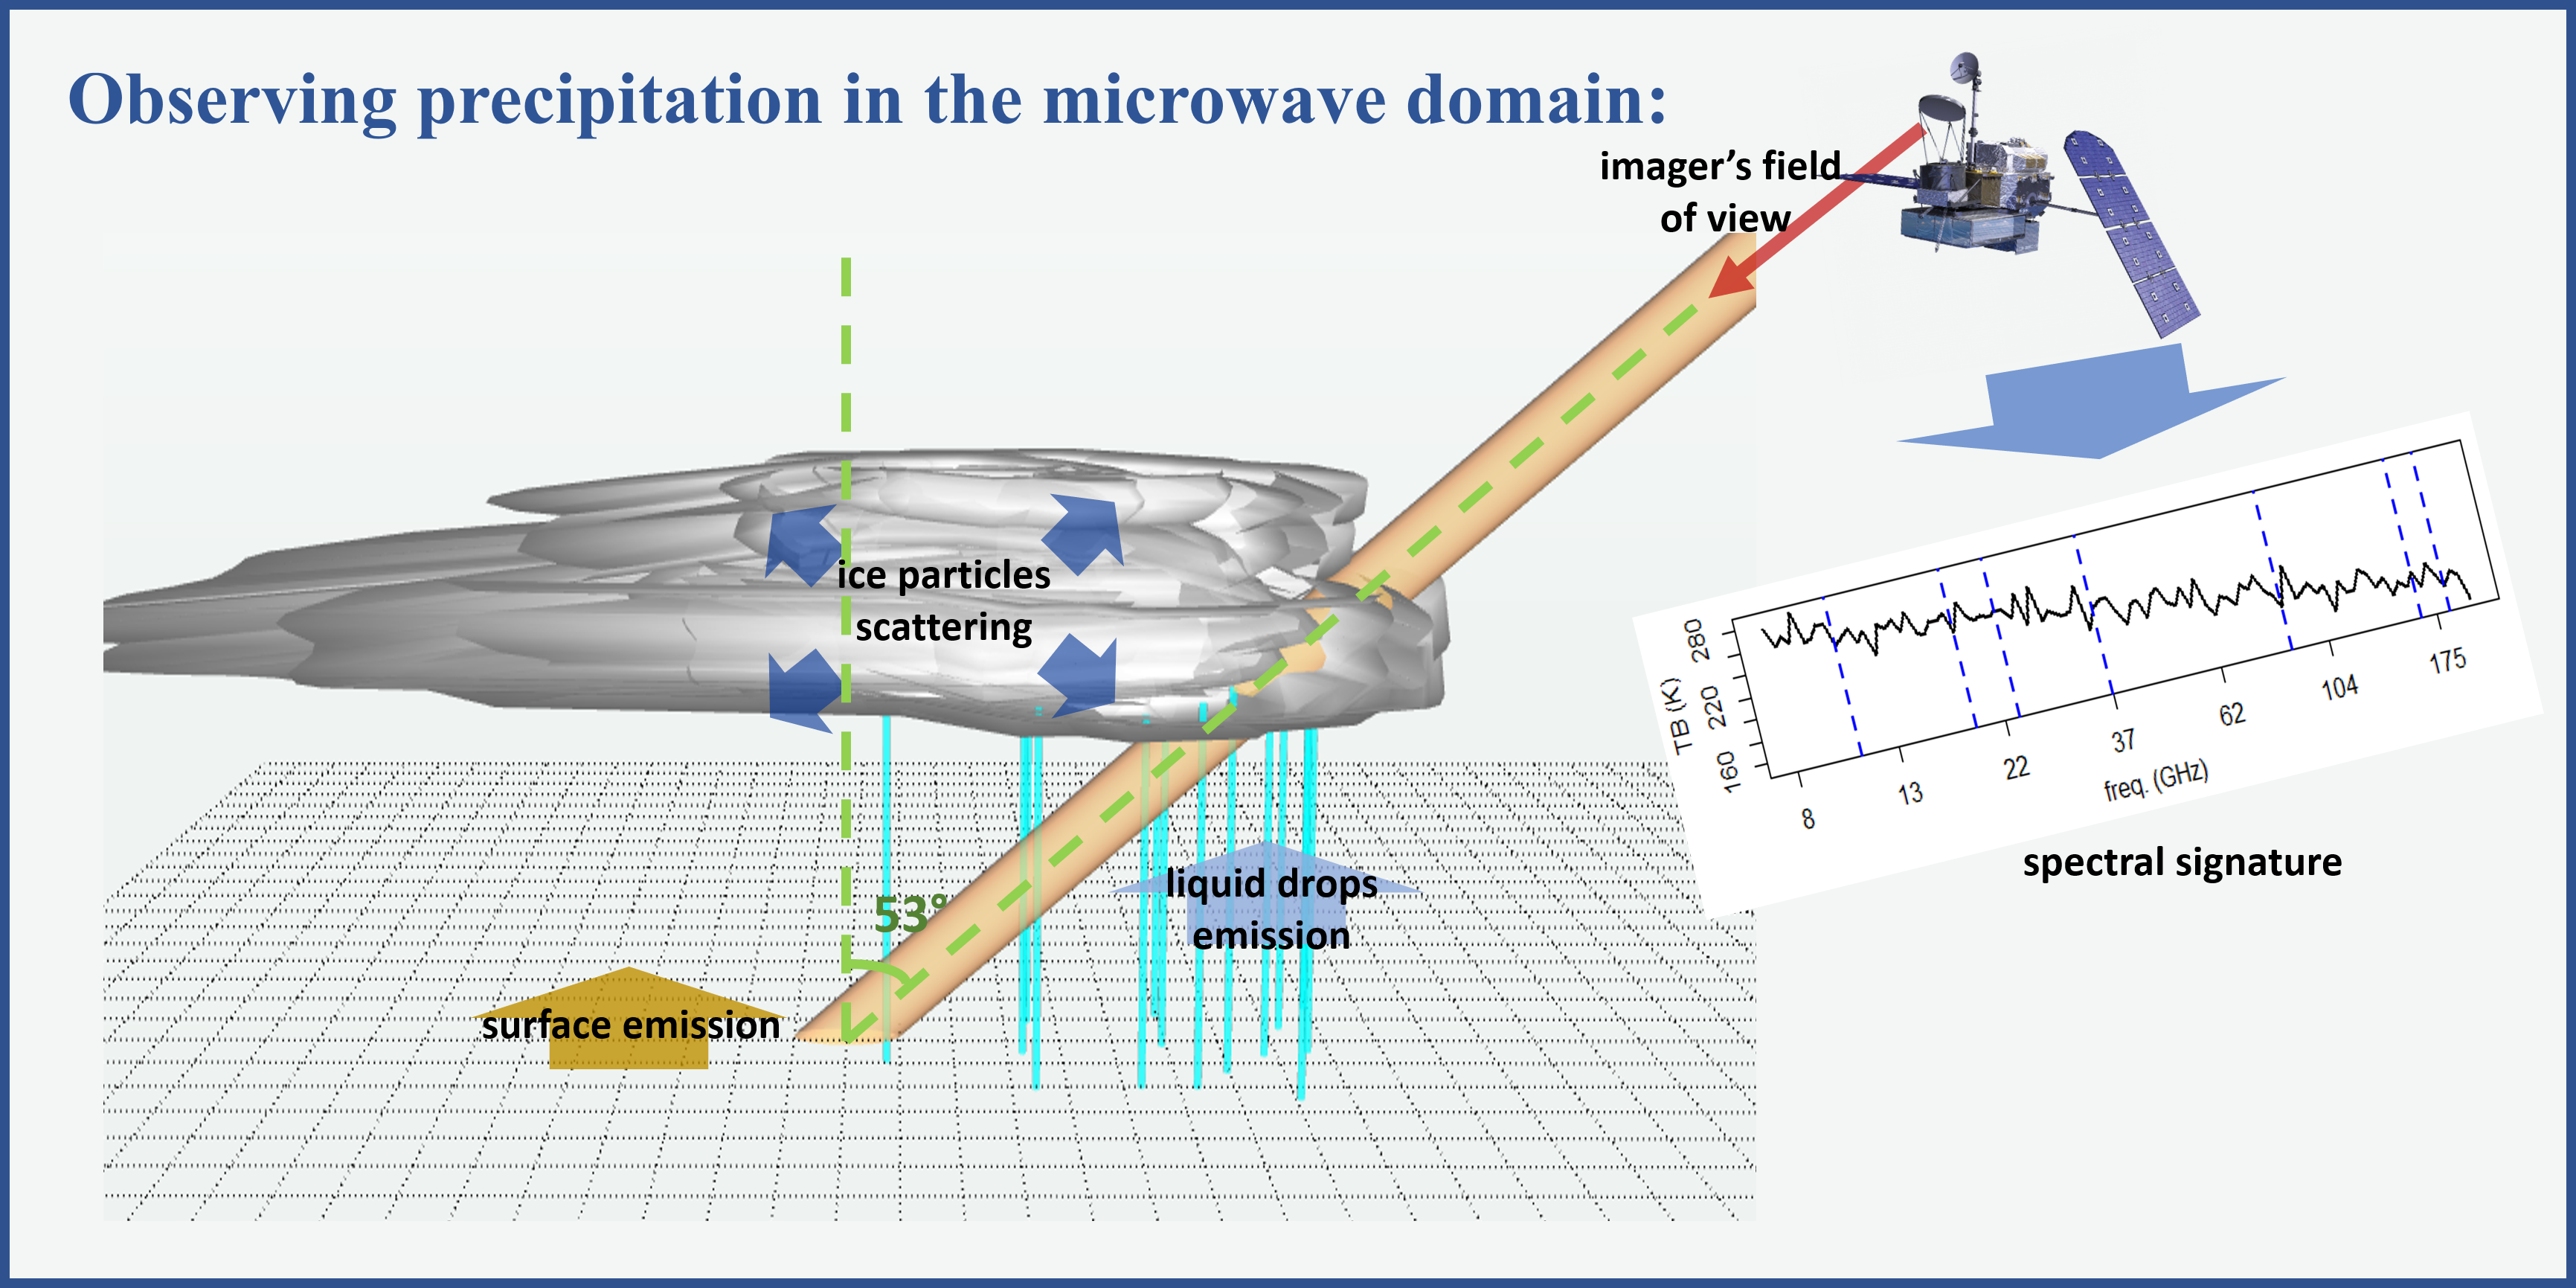 Principle of the observation of precipitation from passive microwave imagers. The measured spectral signature is the product of the surface emission, emission and absorption by liquid rain drops and scattering by ice particles in the atmosphere.
Mean absolute error of the retrieved near-surface precipitation rate over land as a function of the number k of neighbors when using a nearest-neighbor algorithm with and without using nonlocal parameters. Here only three nonlocal parameters are used. The k-nearest-neighbor algorithm relies on a database of 700,000 collocated radar profiles and GMI spectral signatures.
Using patterns and multiscale representations to compare and validate precipitation estimates.
Another part of our work focuses on the comparison and evaluation of precipitation products with metrics that are useful for applications and diagnostics. Typically, the comparison of precipitation products is performed at the pixel level (usually via a scatterplots). Such an approach can be limiting, in particular it is weak at assessing mislocation errors and at quantifying the dependence of the retrieval performance to spatial and temporal scales.
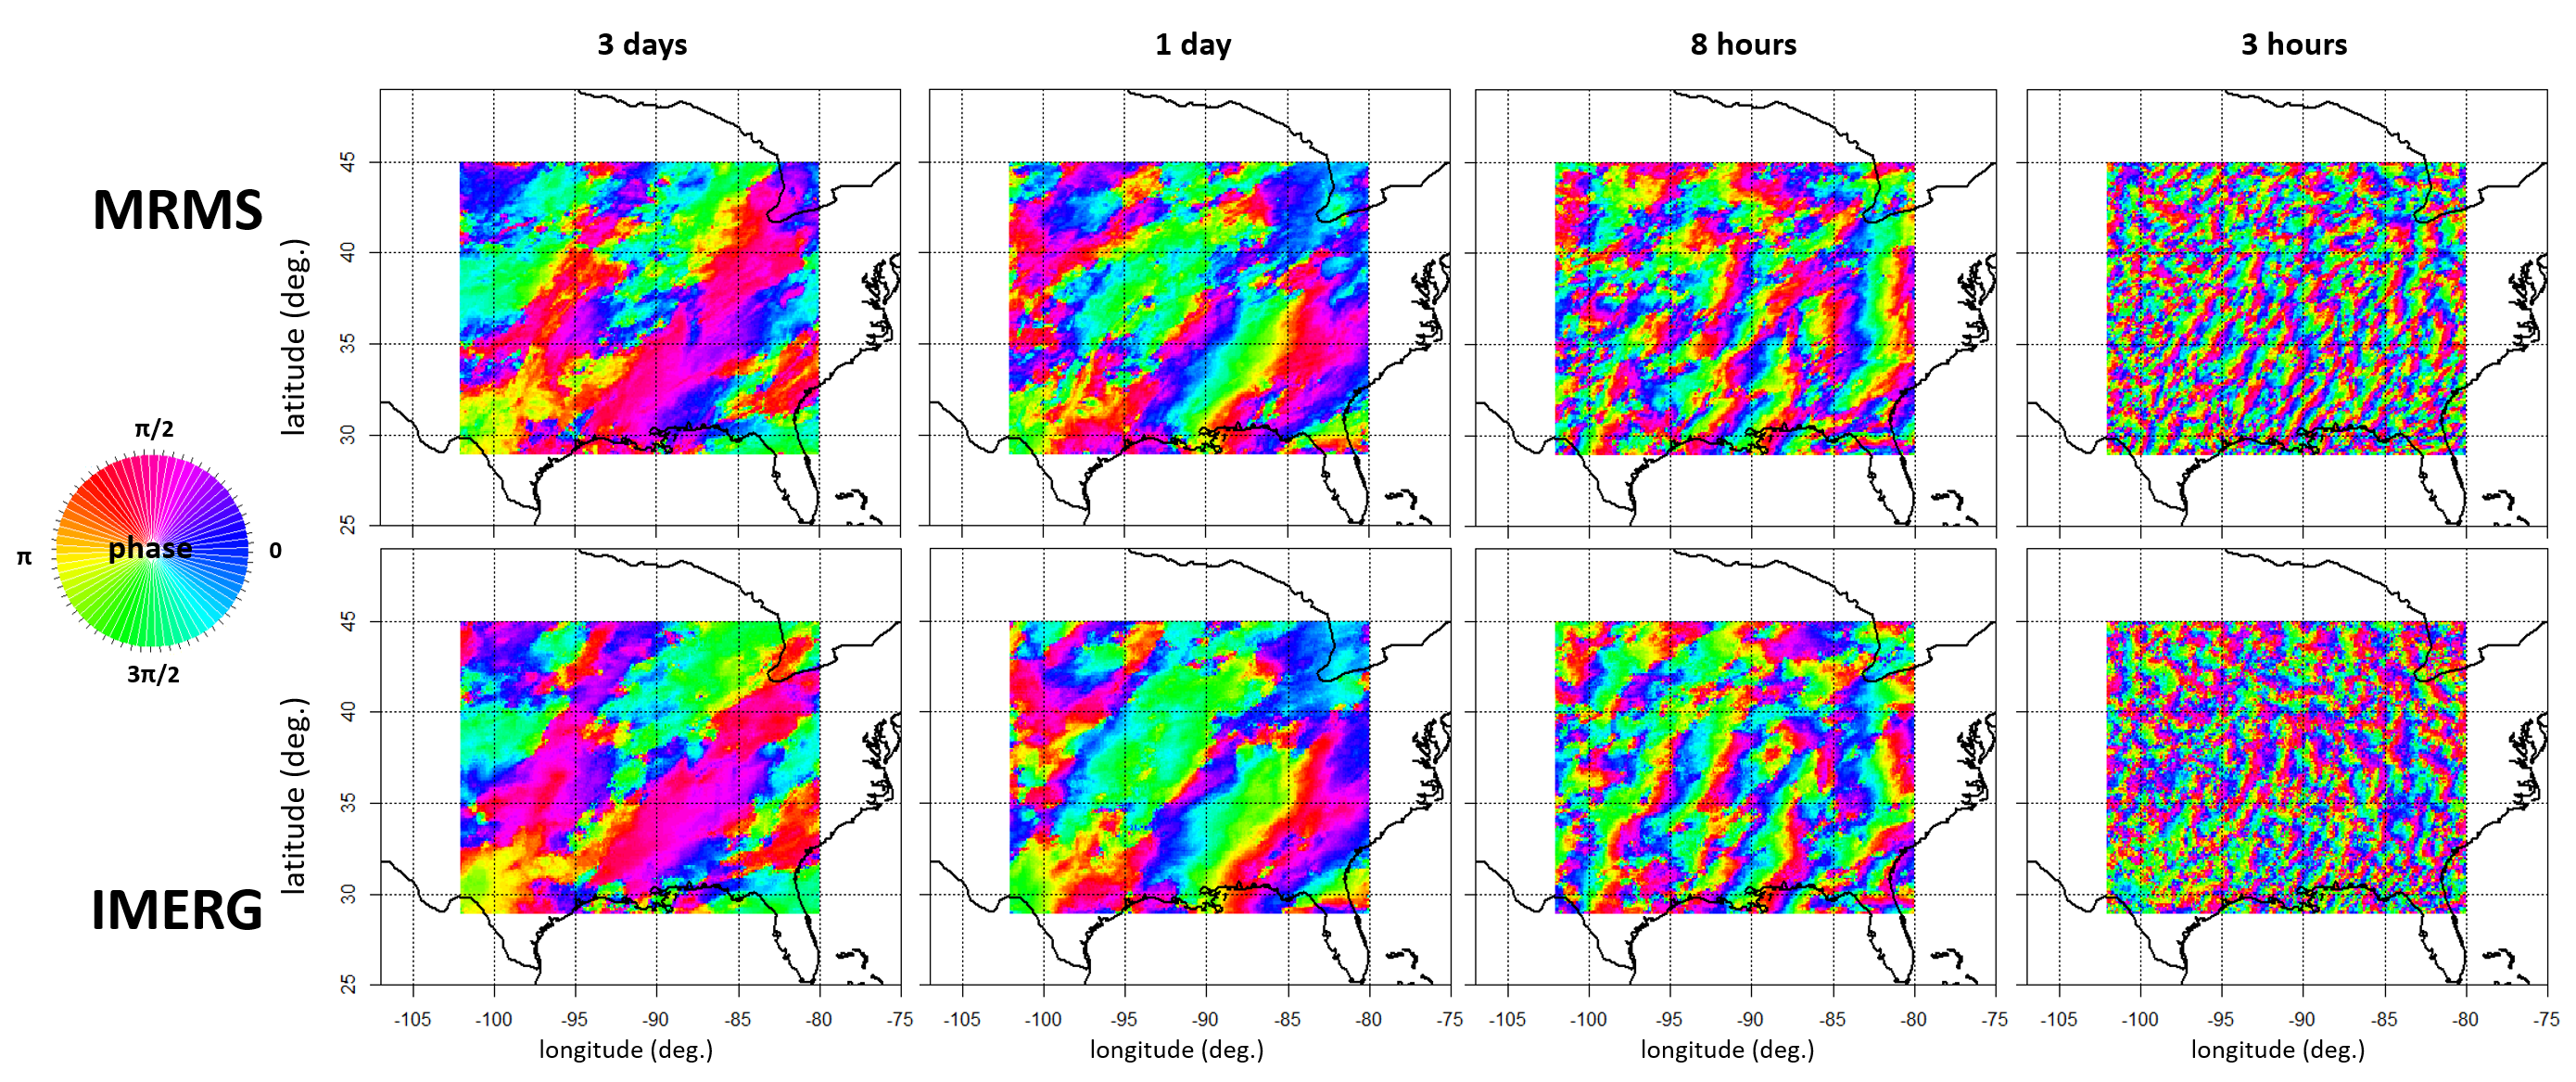
In our previous work, we proposed the concept of "effective resolution" (ER), defined as the smallest scale at which a product is able to reproduce the spatial variability of an underlying field, and developed a wavelet-based methodology to compute the ER of a retrieval product (see Guilloteu et al., 2017). Our current work explores a more general class of spectral transforms to more closely analyze spatial-temporal dynamical modes (e.g., propagation of precipitation features) and couplings in precipitation datasets, and assess the ability of products in reproducing precipitation patterns as a function of spatial frequency/scale.
Temporal phase in the Fourier domain of precipitation over the US at 3 days, 1 day, 8 hours and 3 hours periods, from the MRMS gauge-radar product and form the IMERG satellite product for the April-October 2017 period. The phase informs us on the spatial-temporal dynamics and on the propagation of the precipitation systems.
Coastal Deltas connectivity, self-organization and resilience to change
We study the topology and dynamics of coastal delta channel networks (DCNs) and their connectivity to the surrounding water and land bodies to gain quantitative understanding of transport characteristics, hydroclimatic environments responsible for the formation of the observed patterns, and system resilience to climate and human forcings.
In our previous work, we developed a graph-theoretic framework where deltaic systems are represented as directed acyclic graphs and via spectral analysis of their connectivity matrix (the so-called adjacency matrix) we extract properties of the topology and flux partition of DCNs (Tejedor et al,. 2018). Our ongoing research explores questions of multi-process multi-scale connectivity, principles of optimality in deltaic systems, and quantitative mapping between process and form for delta classification and process inference. We use data from diverse field deltas and from physics-based numerically simulated deltas.
Multiplex networks for multi-process multi-scale connected systems
The hydrologic and biogeochemical connectivity of river deltas extends beyond the delta channel network (DCN) and includes connectivity to surrounding lakes and islands. These diverse connectivity pathways have significantly different time scales of transport (e.g., transport within channels vs. overland transport on vegetated islands) and must be considered jointly to represent and quantify the deltaic system as a whole. We have adopted a multi-layer (multiplex) network framework to directed graphs to study transport along multiple coupled pathways representing within-channel and surface and sub-surface transport processes.
Applying the multiplex framework to the Wax Lake Delta, we have shown that depending on the flood level (degree of hydrologic coupling between the channels and islands), a "super-diffusivity" regime emerges where transport is faster than in the fastest component of the system (in this case the channels). The emergence of this regime, which interestingly does not correspond to the maximum but only an intermediate degree of coupling -- we call it "optimal coupling", is attributed to the opportunistic pathways arising from the multi-scale processes within the deltaic system as a whole. Positioning the return period of the flood giving rise to the optimal coupling regime within the current and future probabilistic flow conditions is expected to provide quantitative insight of system resilience in response to extreme perturbations.
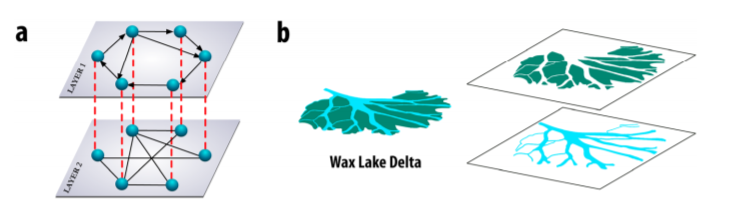 Delta multiplex (a) Illustration of a multiplex: Multiplex are coupled multilayer networks where each layer consists
of the same set of nodes but possibly different topologies (set of links), and layers interact with each other only via replica
nodes in each layer (dashed lines) (b) Wax Lake Delta Multiplex. Illustration of the Wax Lake delta in the Louisiana coast
(United States). The delta multiplex consists of two layers: Layer 1 (bottom) accounts for the channel connectivity and layer
2 (top) represents the connectivity that arises from overland flow on islands. For more details about the multiplex structure
see supporting information.
Self-organization and optimality of river deltas
The form and function of river deltas is intricately linked to the evolving structure of their channel networks, which controls how effectively deltas are nourished with sediments and nutrients. Understanding the coevolution of deltaic channels and their flux organization is crucial for guiding maintenance strategies of these highly stressed systems from a range of anthropogenic activities. To date, however, a unified theory explaining how deltas self-organize to distribute water and sediment up to the shoreline remains elusive.
Our work provides evidence for an optimality principle underlying the self-organized partition of fluxes in delta channel networks. By introducing a suitable nonlocal entropy rate (nER) and by analyzing field and simulated deltas, we suggest that delta networks achieve configurations that maximize the diversity of water and sediment flux delivery to the shoreline. We thus suggest that prograding deltas attain dynamically accessible optima of flux distributions on their channel network topologies, thus effectively decoupling evolutionary time scales of geomorphology and hydrology. When interpreted in terms of delta resilience, high nER configurations reflect an increased ability to withstand perturbations. However, the distributive mechanism responsible for both diversifying flux delivery to the shoreline and dampening possible perturbations might lead to catastrophic events when those perturbations exceed certain intensity thresholds.
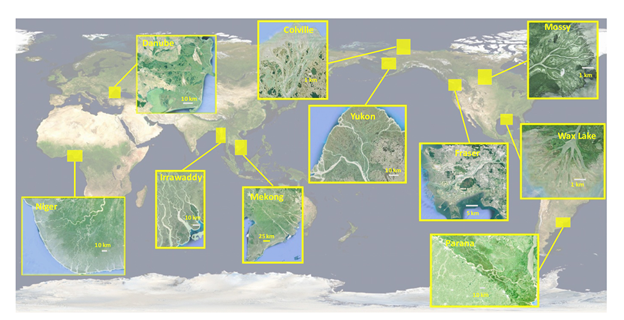 Field deltas and their corresponding location. Ten deltas with diverse morphodynamic environments and of various degrees of channel complexity
were analyzed in terms of their nER. Satellite images provided by Landsat/Copernicus, NASA, Digital
Globe, and CNES/Airbus were extracted from Google Earth. We acknowledge their respective copyrights.
The group's past research concentrated on the following areas: (1) Hydroclimatology and S2S precipitation forecasting, (2) inverse problems for precipitation estimation from space, (3) stochastic theories of water/sediment transport and landscape evolution, and (4) river delta network topology and dynamics for vulnerability assessment. To read more on these topics, please click on a project below:
Hydroclimatology and S2S precipitation forecasting: A new interhemispheric teleconnection (NZI)
We work on enhancing physical understanding of large-scale climate modes of variability and change and their regional hydroclimatic impacts. We also develop new forecasting schemes to optimally combine climate teleconnections in a changing climate for improving subseasonal-to-seasonal (S2S) predictability of regional precipitation.
Based on recent observational evidence, our work has identified a previously undiscovered teleconnection that has intensified during the last four decades, and which has increased potential for earlier and more accurate prediction of winter precipitation in southwestern US (SWUS). Specifically, we found that sea surface temperature (SST) anomalies in the subtropical Pacific off the coast of New Zealand (30°×15° region of 170°E-200°E and 25°S-40°S, termed the NZI region) have emerged as strong and early (three months ahead) predictors of winter SWUS precipitation, with NZI positive (negative) anomalies in the late summer expected to result in below (above) average precipitation in the coming winter.
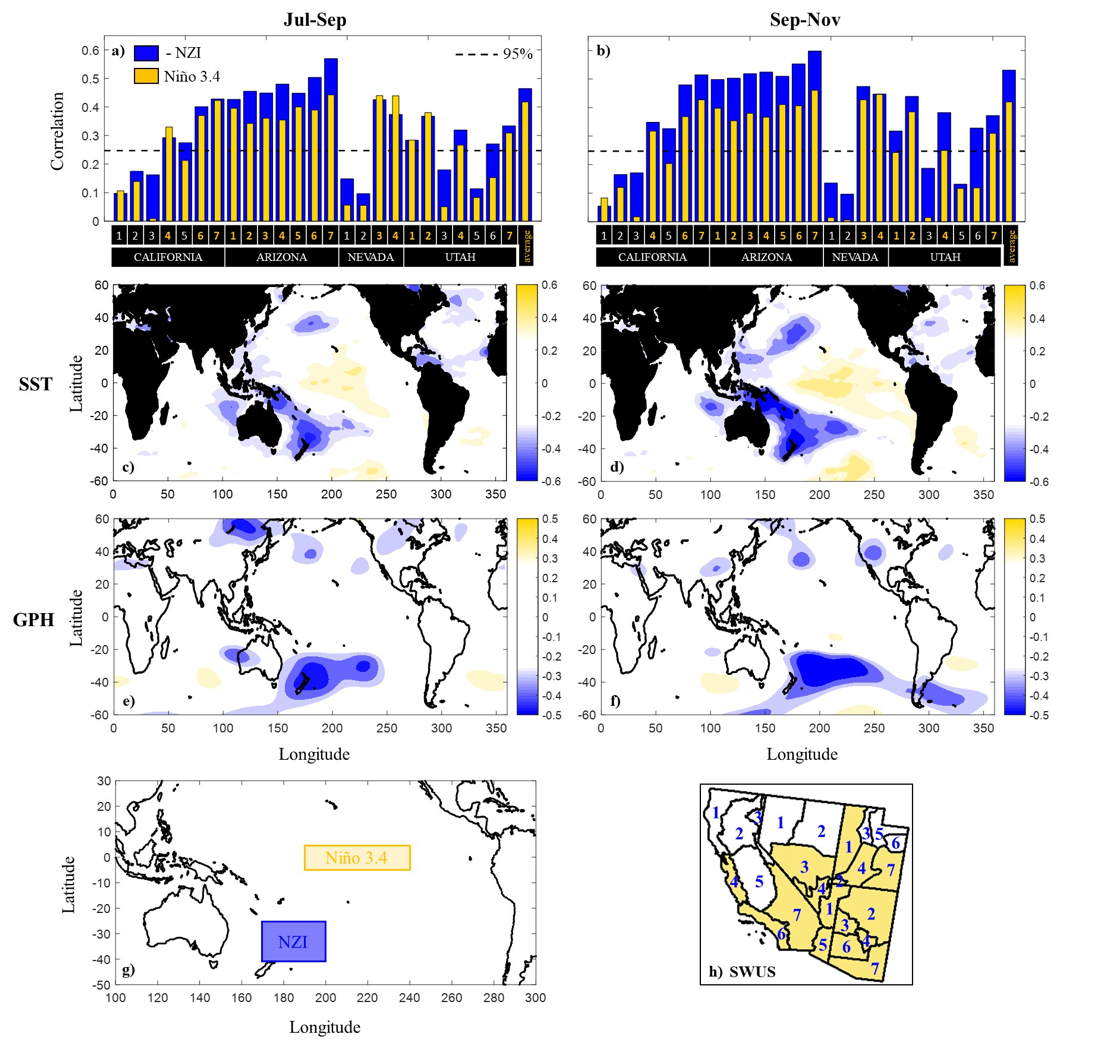 Evidence for a new teleconnection in the southwestern Pacific. a, b Correlation coefficients of –NZI and Niño 3.4 with winter precipitation (Nov–Mar) for all climate divisions of southwestern US (SWUS) and for two different periods (Jul–Sep and Sep–Nov) for 1950–2015. Average precipitation is defined as the area-weighted average precipitation amount over climate divisions where Niño 3.4 exhibits statistically significant correlation (see colored numbers in panels a, b, and regions in panel h). c Correlation map between SST (Jul–Sep) and the average winter precipitation in SWUS for 1950–2015. White color indicates statistically insignificant correlations (α= 0.05 significance level); d Same as c, but SST is averaged over Sep–Nov; e, f Correlation maps as in c, d, but using GPH (400 mb). The emergence of a persistent correlation pattern in the southwestern Pacific (coined as the New Zealand Index, NZI) is robust for both SST and GPH; g the location and areal extent of NZI and Niño 3.4; h The selected climate divisions in SWUS (in color), for deriving the regionally averaged precipitation amount, based on their significant correlation with Niño 3.4.
Climate modes which have been physically linked to precipitation variability in the SWUS, such as the El Niño Southern Oscillation (ENSO), do not exhibit significant statistical relations with precipitation. Notable examples of poor association of ENSO conditions with precipitation include:
• the Mega El Niño in 2015-2016 which was associated with California drought.
• the strong La Niña in 2010-2011 which was associated with wet conditions in southern California.
• one of the wettest years in record for southern California was in 1992-1993, when ENSO was neutral.
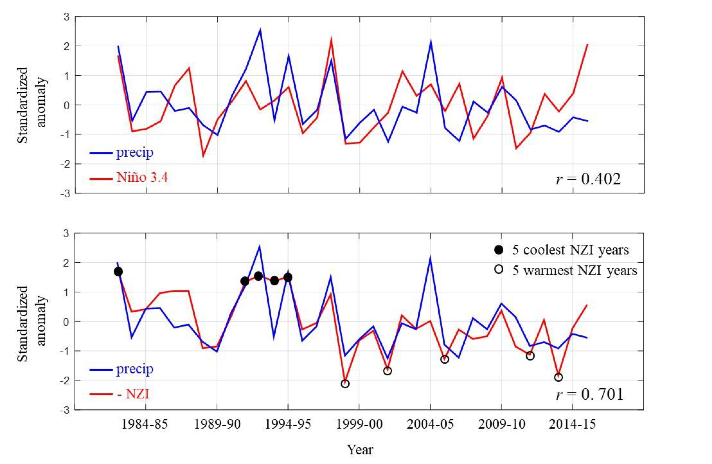
During the last three decades, NZI associated more strongly with the average winter precipitation in the SWUS than Niño 3.4. NZI and Niño 3.4 anomalies correspond to Sep-Nov, while average winter (Nov-Mar) precipitation is computed over climate divisions of significant correlation with Niño 3.4. In the lower panel, the 5 coolest/warmest NZI years are indicated (lower/upper ~15%).
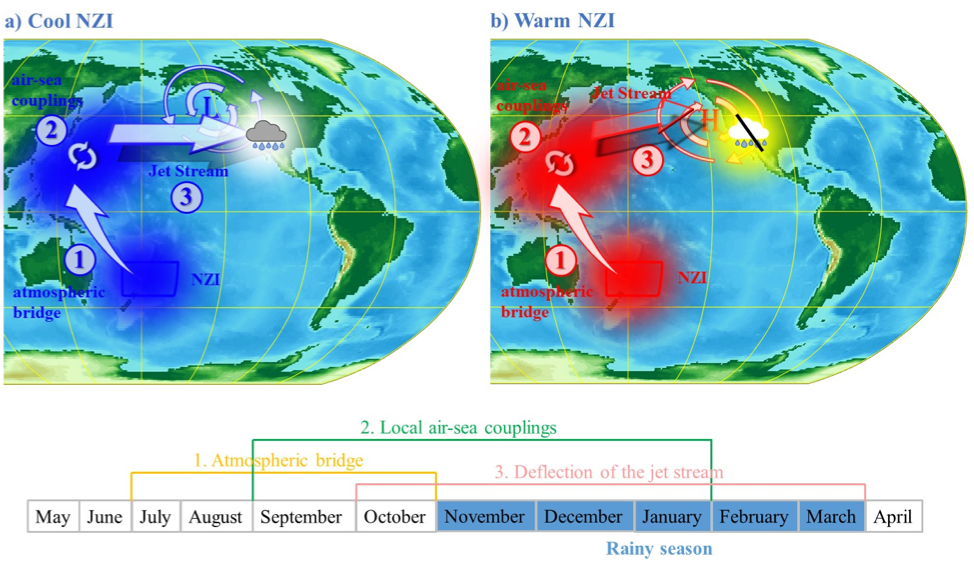
The teleconnection depends on a western Pacific ocean-atmosphere pathway, whereby sea surface temperature anomalies propagate from the southern to the northern hemisphere during boreal summer.
The New Zealand Index (NZI) teleconnection depends on a western Pacific ocean–atmosphere pathway. a Negative SST anomalies (blue shading) in the NZI region cascade in the northern hemisphere through a late summer interhemispheric atmospheric bridge and are maintained by air-sea coupling until the following winter. The SST anomalies affect the atmospheric pressure in the US west coast and strengthen the regional jet stream which brings more winter storms in the SWUS; b Late-summer positive SST anomalies (red shading) in the NZI region deflect the jet stream to the north, leading to dry conditions over the SWUS.
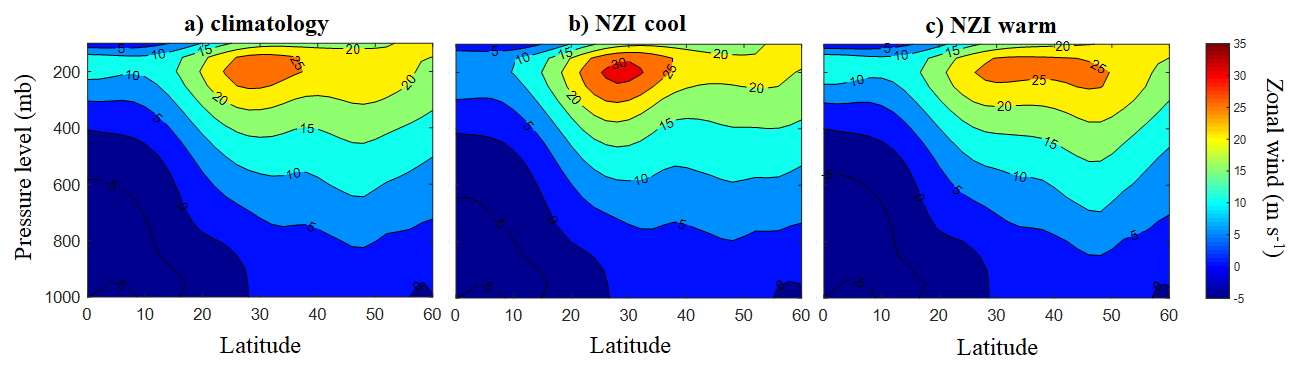
NZI affects the upper zonal winds in the northeastern Pacific and modulates SWUS precipitation. a Zonal average (220°E–260°E) of zonal wind in m/s for different latitude and pressure levels, during Nov–Mar, for 1982–2015; b Same as (a), but for the 5 coolest NZI years; c Same as (a), but for the 5 warmest NZI years.
Publications:
Mamalakis, A., J.-Y. Yu, J.T. Randerson, A. AghaKouchak, and E. Foufoula-Georgiou (2018)
A new interhemispheric teleconnection increases predictability of winter precipitation in southwestern US, Nature Communications, DOI: 10.1038/s41467-018-04722-7
Estimating precipitation from space
We work on new and innovative formalisms for inverse estimation problems (downscaling, data fusion, retrieval, and data assimilation) of precipitation using multi-sensor, multi-scale measurements from space. The proposed frameworks draw upon: (1) recent observations that precipitation fields exhibit "sparsity" in a gradient or wavelet domain (a manifestation of the coherent multicellular structure of rainfall and the presence of sharp fronts), and (2) new theoretical developments in the signal processing community for non-linear, non-smooth data recovery from noisy, blurred and downsampled signals based on Compressive Sensing (CS). In contrast to the widely used formulation of these problems using least-squares variational frameworks, the proposed approach incorporates a non-smooth term (L1 norm) in the wavelet domain, consistent with sparsity and allowing preservation of extremes and localized features. We also work on developing methodologies for non-parametrically handling biases in data assimilation of land-surface states based on the theory of Optimal Mass Transport (OMT).
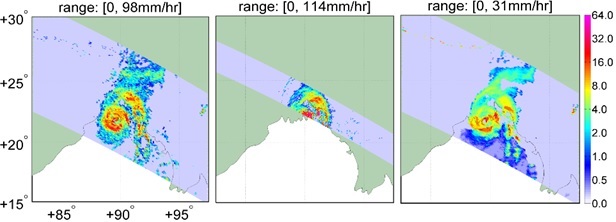 Rainfall retrievals for the TRMM overpass on November 15, 2007 above the cyclone Sidr at UTC 13:59, including the results from: ShARP (left panel), 2A25 (middle panel) and 2A12 (right panel). The results show the promises of ShARP to improve the rainfall retrieval at the vicinity of coastlines, relevant to coastal hydrologic analysis and deltaic systems.
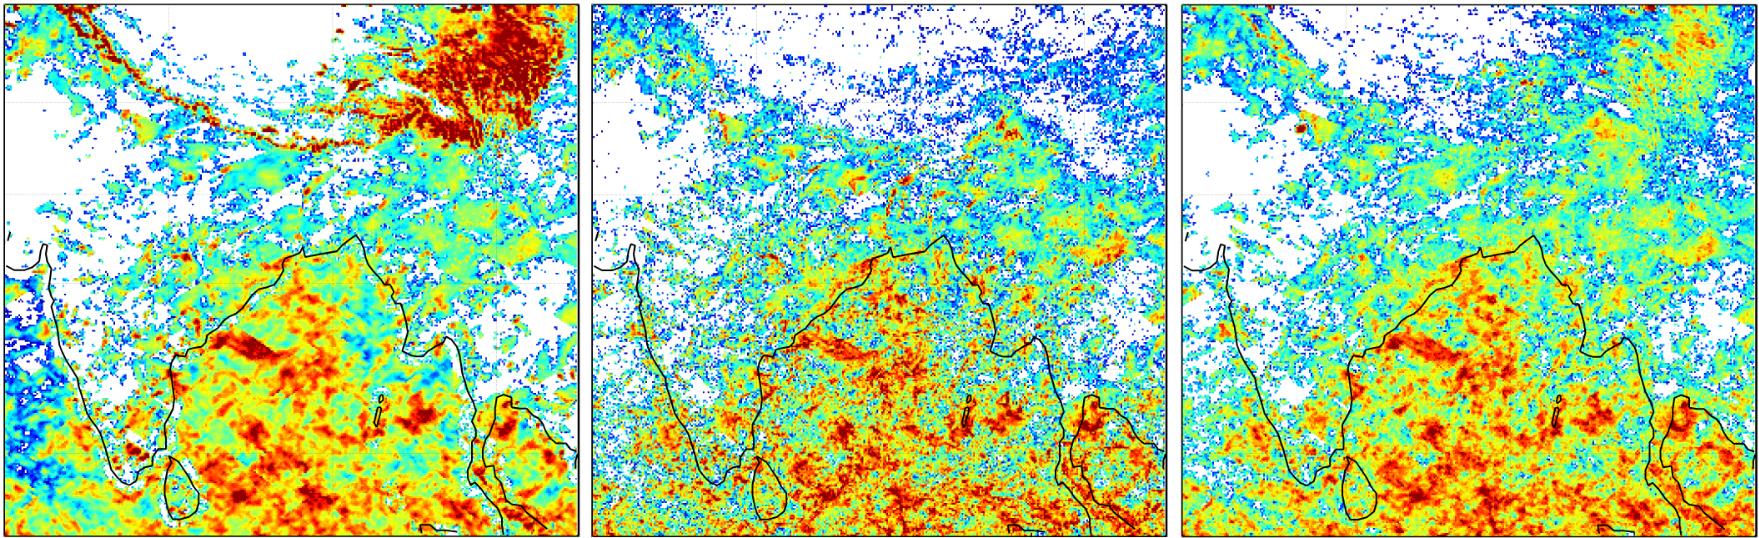
The three month rainfall [mm] retrievals--October-December of 2013--over the southwest Asia including the Tibetan Highlands and Ganges-Brahmaputra-Meghna river basin, shown at 0.1-degree. The standard TMI-2A12 (left panel), radar PR-2A25 (right panel) and ShARP retrievals. The results clearly indicate that ShARP can significantly mitigate the effects of background noise due to snow cover lands, which results in rainfall over estimation over the Himalayan range and headwaters of the Brahmaputra river basin. These results promise improved hydrologic analysis of mid-latitude and in cold climates.
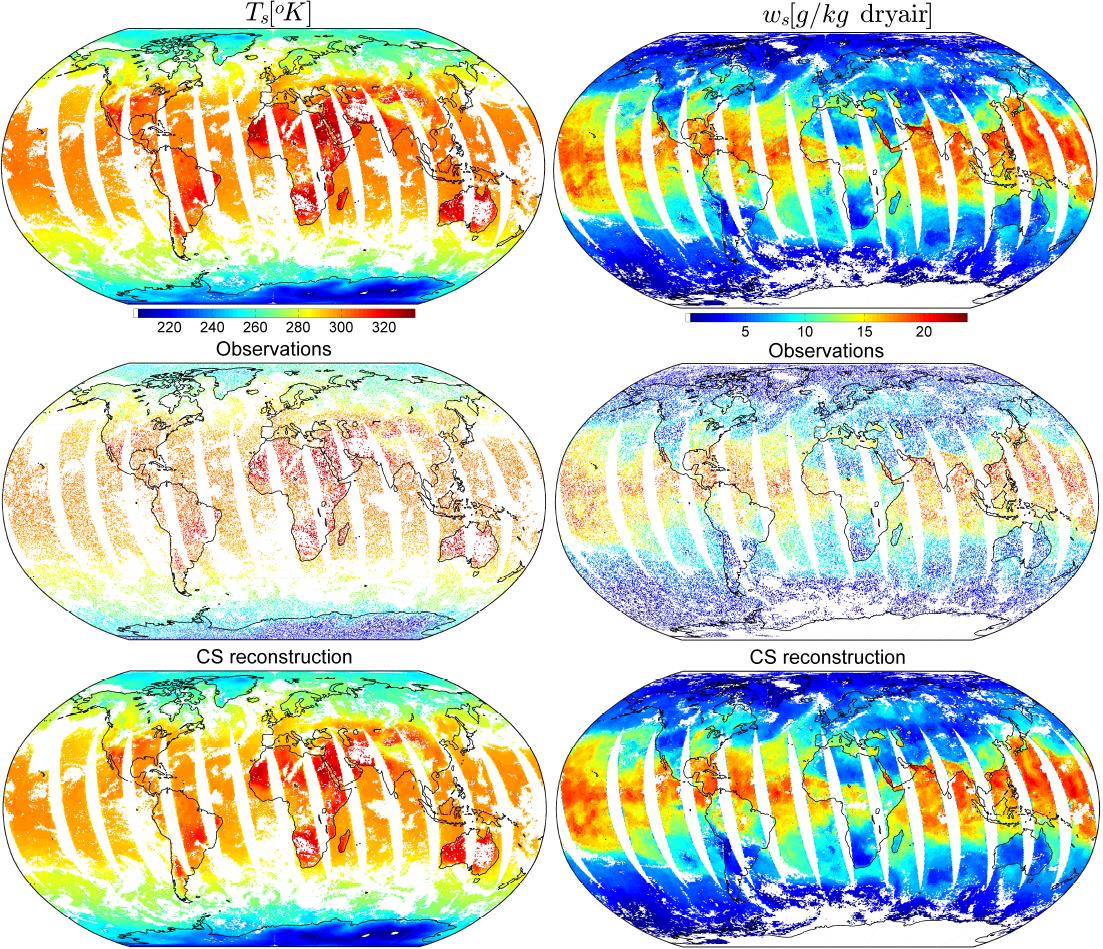 Compressive Sensing (CS) reconstruction of the surface skin temperature [Kelvin] (left column, 01/01/2002) and surface water vapor mass mixing ratio [g/kg dry air] (right column, 09/09/2002) for all daily ascending orbital tracks. The originally retrieved fields (top row), the randomly under-sampled fields (middle row), and the CS reconstructed fields (bottom row). The under-sampled fields only contain 45% of randomly chosen pixels, which are also corrupted with a white Gaussian noise. The data are obtained from level II, AIRS/AMSU retrievals.
Water/sediment transport and landscape evolution
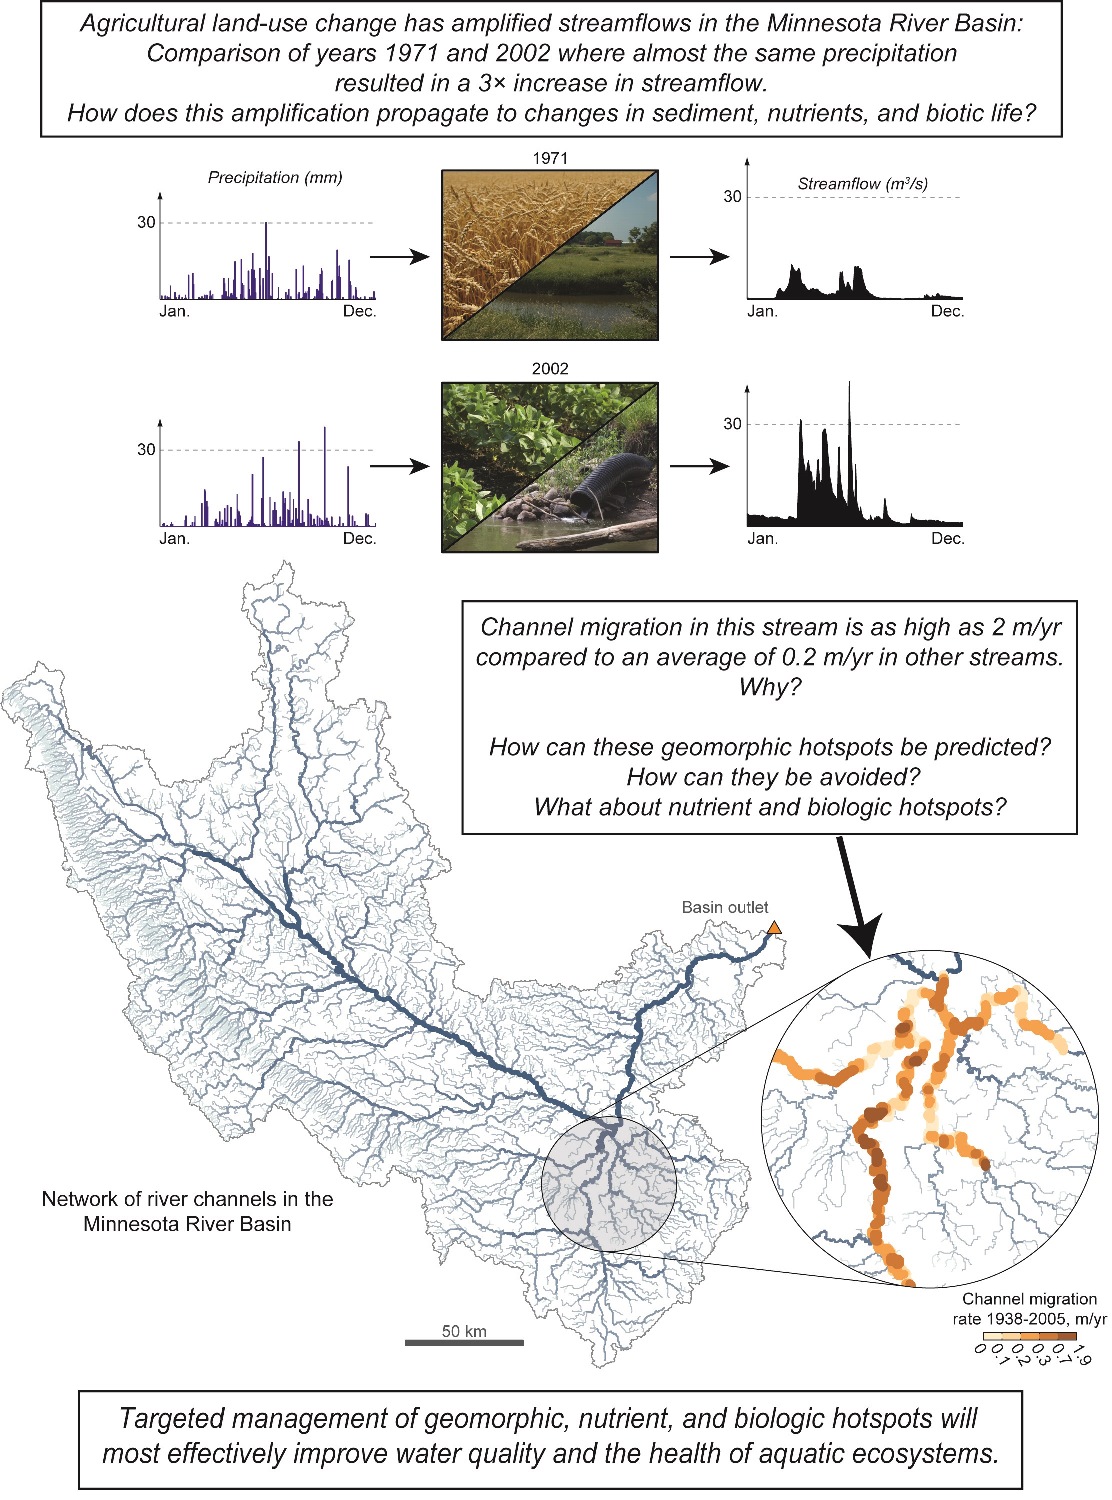
We explore new methodologies for quantifying the stochastic nature of bedload sediment transport using multiscale analysis and dynamical system theory. We seek to understand the relations between near bed turbulence, river bed morphodynamics and sediment transport using experimental, theoretical, and numerical research. At the basin scale, we investigate network-based frameworks for identifying potential synchronizations and amplifications of sediment delivery to basin outlets and also for identifying hotspots of fluvial geomorphic change based on dynamic connectivity. Dynamical frameworks for the analysis of river meandering dynamics, inferring process from form, and quantifying response to perturbations are also studied. Finally, landscape re-organization under climate change is studied using both controlled laboratory experiments and theoretical approaches.
 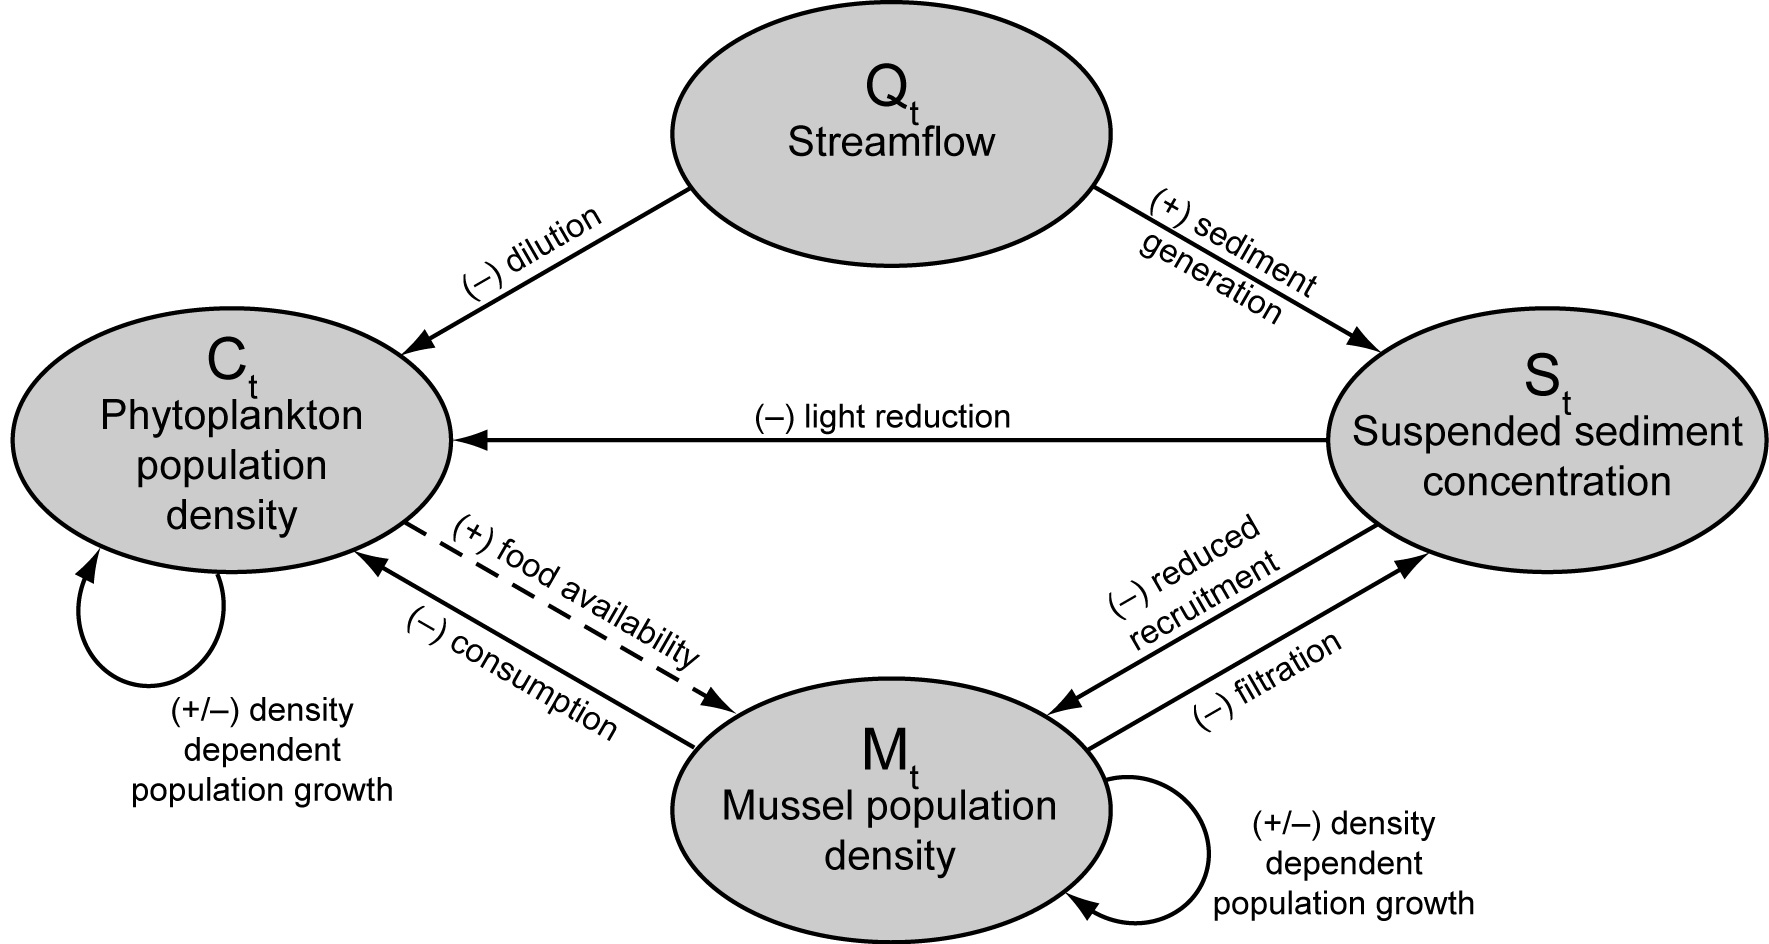 Process interaction network showing the coupled hydro-geo-biological system that is incorporated into a dynamic model and applied to the Minnesota River Basin. Black dashed lines show weak interactions and black solid lines show strong interactions, which are either positive (+) or negative (-).
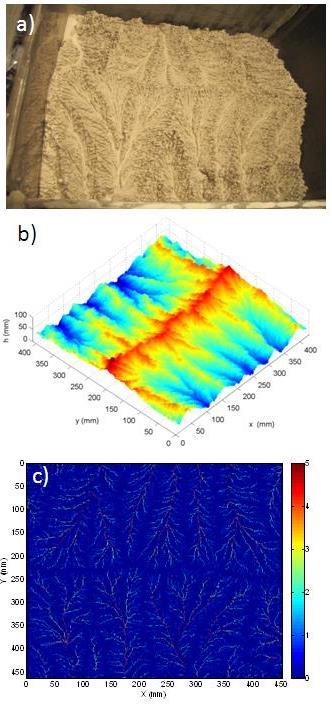
Photograph (a) and the DEM (b) of the evolved landscape at the steady state obtained from the eXperimental Landscape Evolution (XLE) facility at the St. Anthony Falls laboratory of University of Minnesota. The river network at the steady state extracted from the DEM at steady state is shown in (c) with the color bar indicating Strahler channel order. Notice the 5th order channels present in the drainage basins. These experiments were conducted to understand how landscapes respond to climate dynamics in terms of macro-scale (average topographic features) and micro-scale (landform re-organization) reorganization.
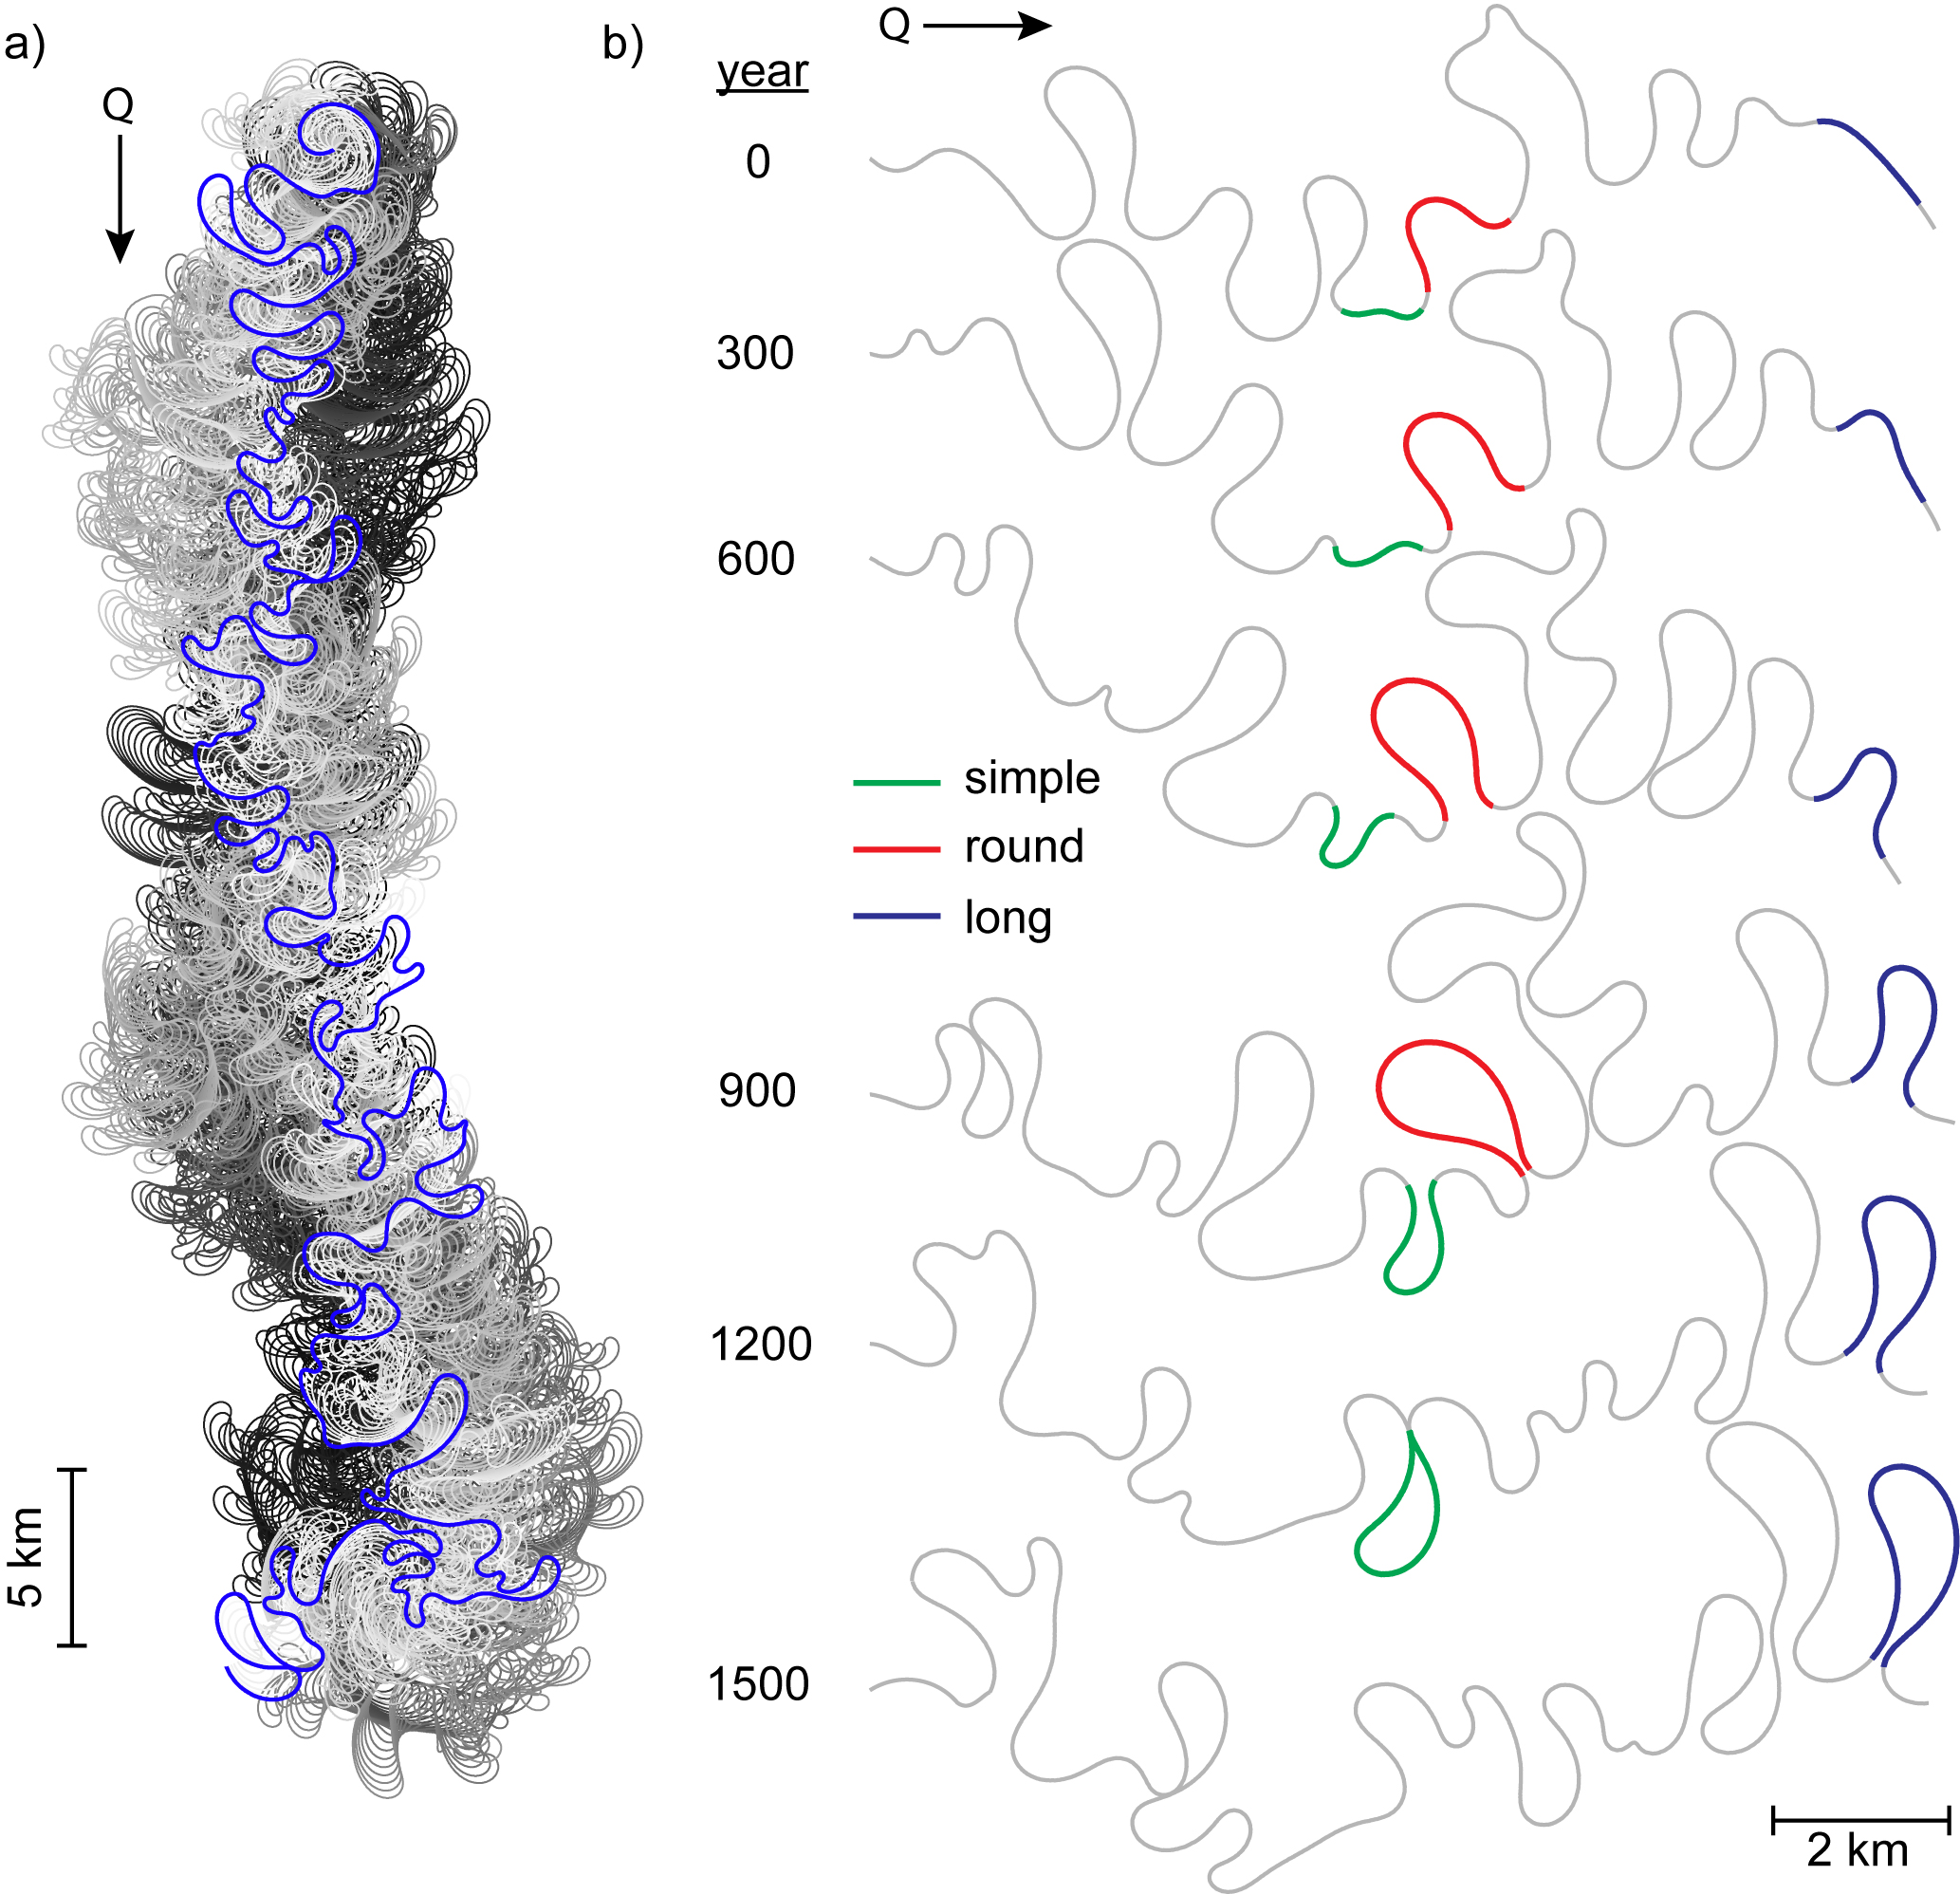 Results of the long-term simulated meandering river. (a) 30,000 years of modeled centerline realizations. Older centerlines are darker; the blue centerline shows t=30,000 years. The upstream boundary condition fixes the first centerline node in place, leading to the formation of the spiral pattern at the upstream boundary. No restrictions are placed on the downstream node so the river may migrate freely. (b) A reach of simulated centerline selected shows the growth and cutoff of all three atom types. Realizations are 300 years apart. Note the complex multilobe meander that starts as double lobed but develops a third lobe before cutting off between 900 and 1200 years.
Coastal deltas and vulnerability assessmentWe explore quantitative frameworks for studying river delta topology and dynamics based on graph-theoretic approaches, where deltaic systems are represented by rooted directed acyclic graphs. Using results from spectral graph theory we develop methods for systematic identification of the upstream and downstream subnetworks, computing steady flux propagation in the network, and finding partition of the flow at any channel among the downstream channels. Using these attributes we construct vulnerability maps that quantify the relative change of sediment and water delivery to the shoreline outlets in response to possible perturbations in hundreds of upstream links. We also develop metrics that capture unique physical, topological, and dynamical aspects of delta networks with the ultimate objective that deltas projected in such a "metric space" can be compared and contrasted and also analyzed for relative vulnerability (or resilience) to change.
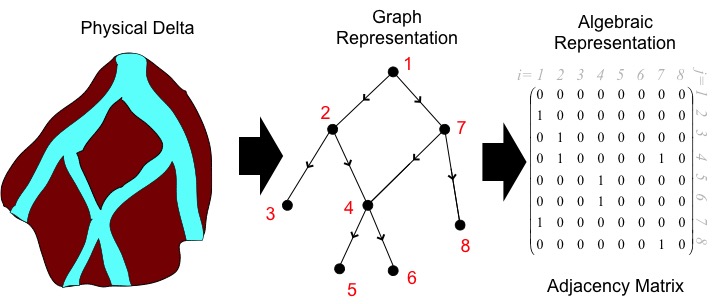 Quantitative framework for studying delta channel network connectivity based on spectral graph theory. The river delta, characterized by its channel network, is represented by a directed graph, i.e., a collection of vertices (bifurcations and junctions in the delta) and directed edges (channels in-between vertices, where the direction is given by the flow). All information about the network connectivity can be stored in a sparse adjacency matrix that allows us to extract important network topologic information by straightforward algebraic manipulations.
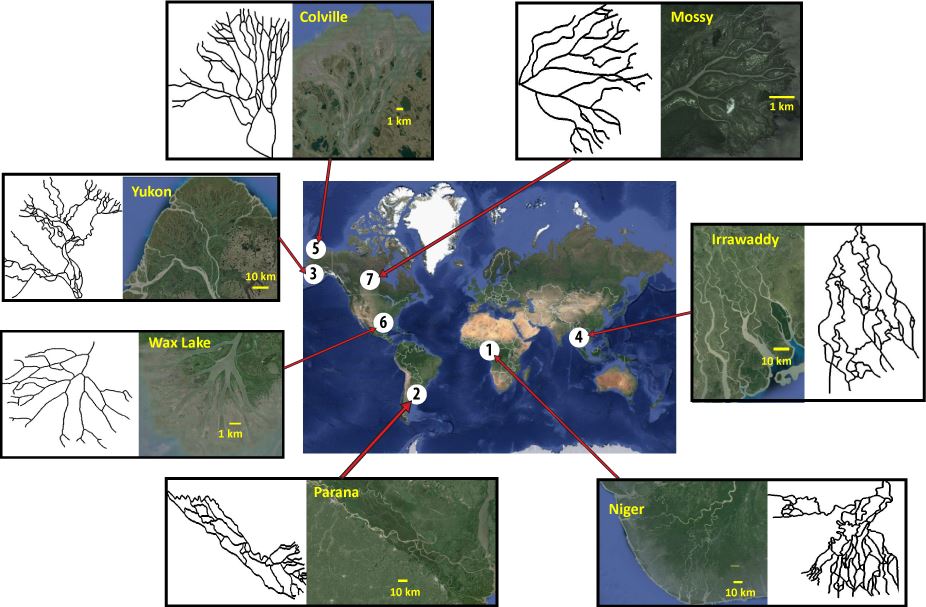
Location of seven deltas and their corresponding channel networks numbered according to size (largest to smallest area). We used the Smart and Moruzzi [1971] networks for (1) Niger, (2) Parana, (3) Yukon, (4) Irrawaddy, and (5) Colville Deltas. For (6) Wax Lake we used the network extracted by Edmonds et al. [2011]. We have extracted the network of (7) Mossy from Google Earth. Satellite images are copyrighted by Digital Globe Inc. 2014.
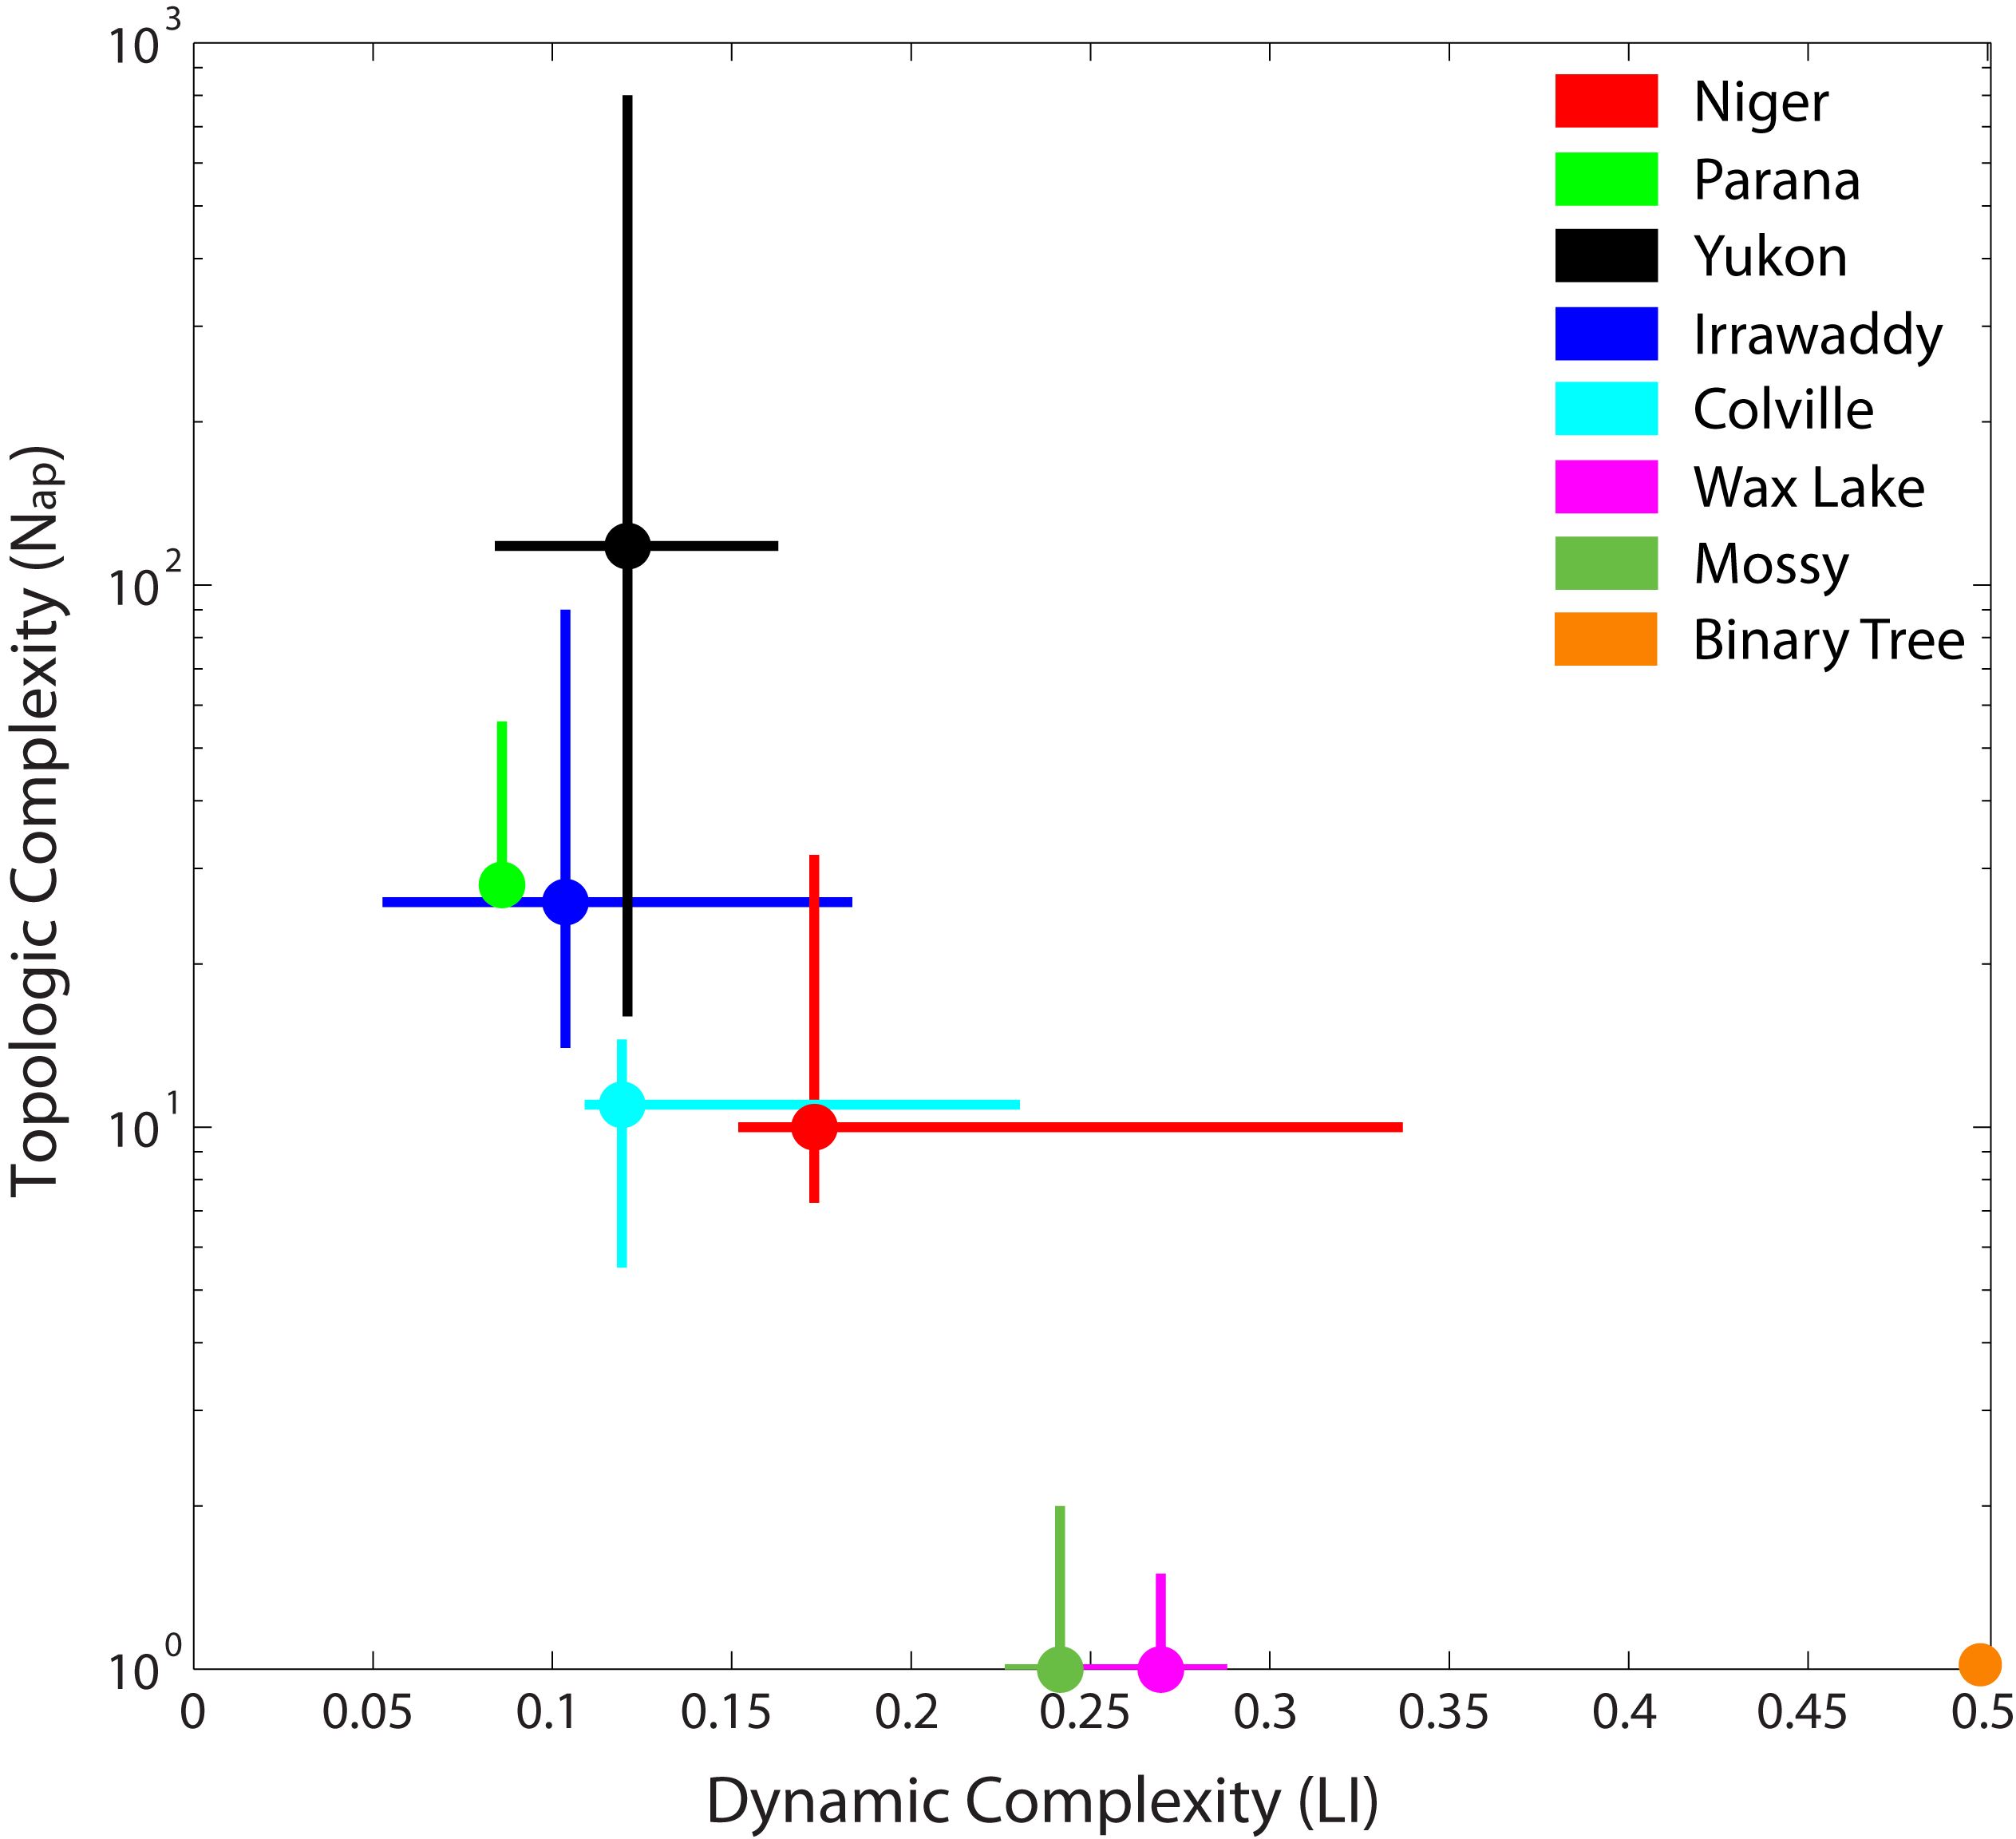 Topo-dynamic complexity space for deltas. We project deltas into a topo-dynamic space whose coordinates are given by the topologic and dynamic delta complexity metrics, and show that this space provides a basis for delta comparison and physical insight into their dynamic behavior. Here, the x-axis corresponds to the dynamic exchange of the different subnetworks measured by the Leakage Index (LI), and the y-axis corresponds to the topologic complexity measured by the Number of alternative paths from apex to outlet (Nap). Each colored cross corresponds to a different delta, and the orange dot corresponds to a binary tree. The vertical (horizontal) component of each cross runs from the 25th until the 75th percentile of the Number of alternative paths (Leakage Index).
|